Data Reports
Institutional Data
IR prepares numerous reports throughout the year on a wide range of subjects. The CCCC Fact Book takes information from various sources and packages it together in an easy-to-read format. Information presented in the Fact Book includes top transfer institutions, curriculum enrollment, demographic information for students, graduation rates, and financial aid statistics. Every year, CCCC must submit data to the National Center for Educational Statistics (NCES) through the Integrated Postsecondary Education Data System (IPEDS). This data includes information on enrollment, graduation, finances, and human resources. The IPEDS Data Feedback Report is intended to provide institutions a context for examining the data they submitted to IPEDS. CCCC’s data is compared to a group of peer institutions for benchmarking purposes.
Fact Book
IPEDS Data Feedback Report for CCCC
Institutional Research Data Dashboards (CCCC Login Required)
State Data
The North Carolina Community Colleges System Office (NCCCS) facilitates and supports college and system fulfillment of national, regional, and state reporting requirements. Associated reporting efforts help colleges identify institutional strengths and weaknesses by providing access to historical trends and peer comparisons. The Performance Measures for Student Success Report is the NCCCS's major accountability document. This annual performance report is based on data compiled from the previous year and serves to inform colleges and the public on the performance of our 58 community colleges.
State Performance Measures
- PM1 - Basic Skills Measurable Skill Gain Rate
- PM2 - Success Rate in College-Level English
- PM3 - Success Rate in College-Level Math
- PM4 - First-Year Progression/Persistence
- PM5 - Curriculum Completion
- PM6 - Licensure and Certification
- PM7 - College Transfer Performance
Other Pertinent State Data
- Total Headcount by Academic Year
- Curriculum Headcount by Terms
- Continuing Education Headcount by Terms
- Curriculum Program Enrollments by Term
- FTE - Total Instructional Activity
- FTE - Curriculum Instructional Activity
- FTE - Continuing Education & Basic Skill Instructional Activity
- Curriculum Grade Distributions
Institutional Surveys
In addition to helping members of the campus community with ad-hoc surveys, Institutional Research administers several annual surveys to learn more about the student and employee experience at CCCC for continuous improvement purposes. Below is a list of annual surveys conducted by IR with short descriptions for each.
- Applied But Did Not Enroll Survey: The Applied But Did Not Enroll Survey seeks to identify impediments that prevent student applicants from completing the enrollment process. The data from this survey allows us to assess what barriers to entry exist and how we can make the process easier and more efficient for students in the future.
- Employee Climate Survey: The Employee Climate Survey is sent either annually or biennially to all current CCCC employees to allow for the collection of anonymous feedback on their experiences. College leadership is able to use the valuable feedback collected from this survey to make policy decisions to improve employee morale, address workplace conditions, and to implement improvements to the college as a whole.
- Employer Satisfaction Survey: The Employer Satisfaction Survey is provided to employers who hire CCCC graduates. The feedback from this survey allows us to assess how effective our educational programs are in preparing students for the workforce.
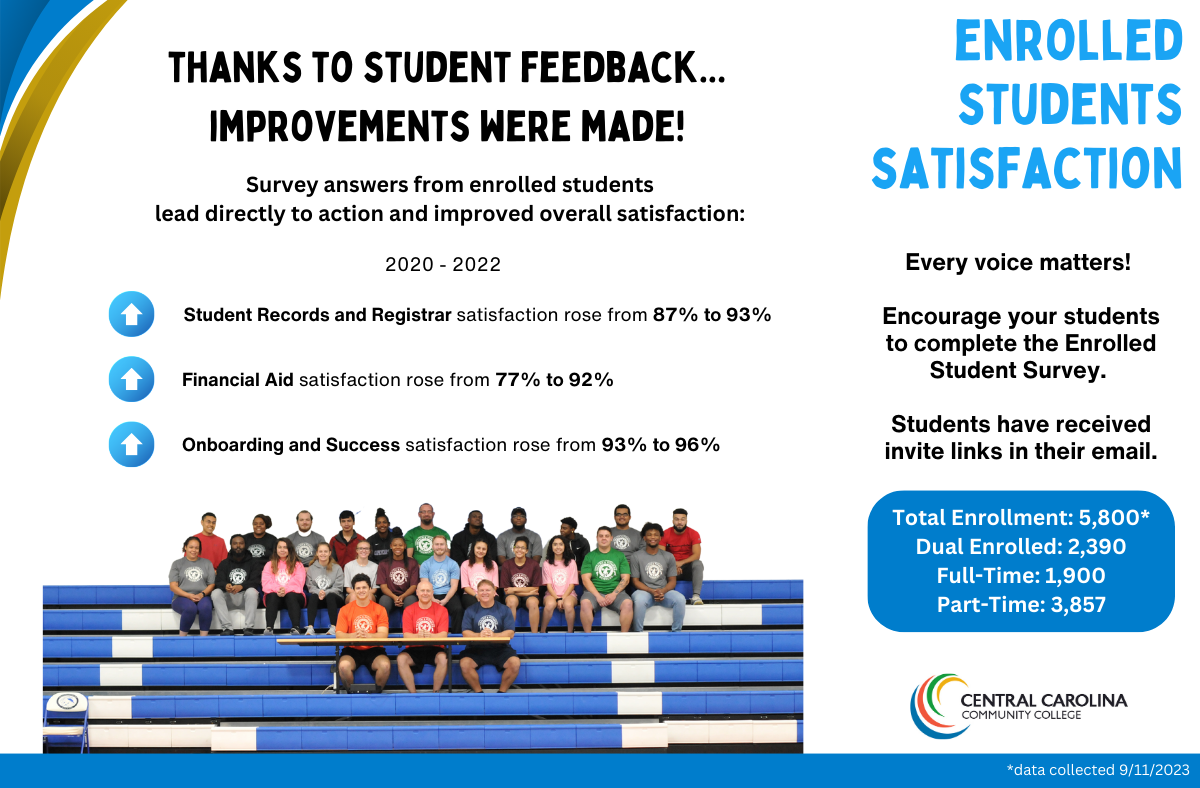
- Enrolled Student Satisfaction Survey: The Enrolled Student Satisfaction Survey asks current students to identify which campus resources are most effective and which need improvement. It allows us to assess student awareness and utilization of various offices and support services.
- Graduate Reflection Survey: The Graduate Reflection Survey is a broad spectrum survey that allows graduates to reflect upon their overall experience at CCCC. Graduates are encouraged to provide feedback on what worked well for them, and to explain where they may have experienced challenges during their time here.
- Non-Completer Survey: The Non-Completer Survey is used to determine which factors may have prevented students from completing their program of study. This allows us to assess the factors impacting our graduation rate and to learn how we can work to improve student success overall.
Infographics
On a monthly basis, IR creates a new infographic utilizing collected information that might otherwise go underused. In doing so, IR attempts to bring light to an underreported yet significant aspect of the College. These infographics are created using data visualization software in hopes that presenting the information in an accessible and appealing way breathes new life into it.
- February 2024, Data We're Loving
- January 2024, New Year, New Tools
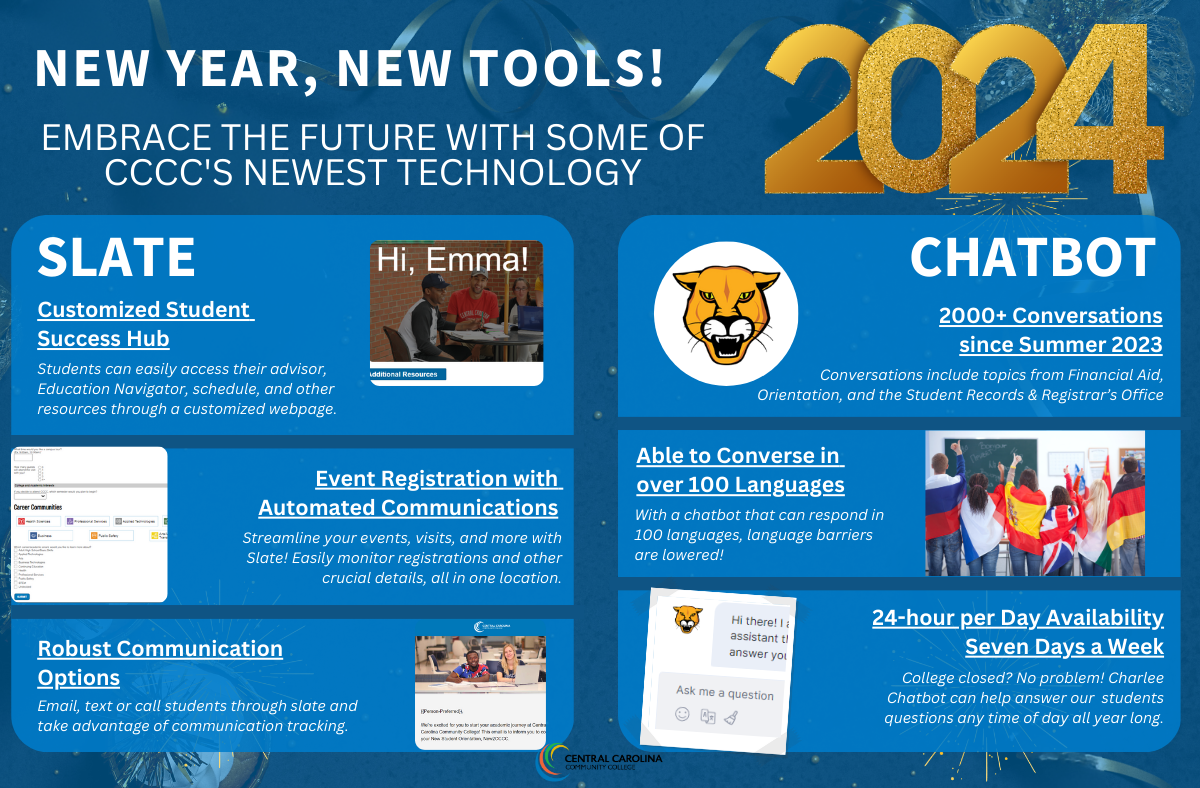
- December 2023, 2023 Year In Review
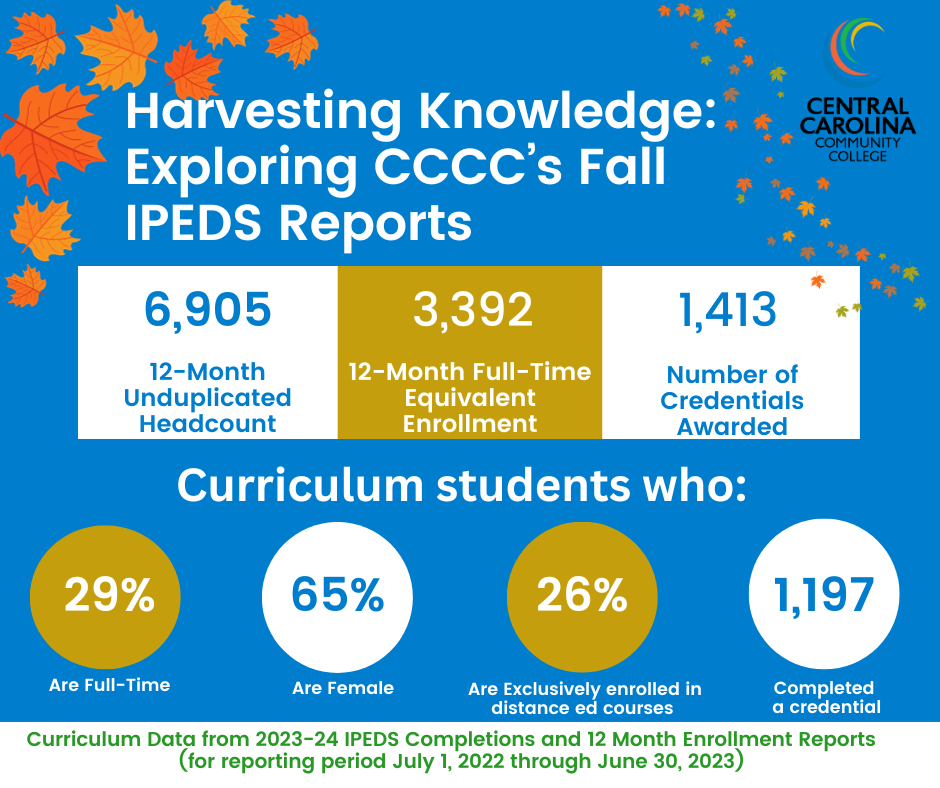
- November 2023, Harvesting Knowledge: Exploring CCCC’s IPEDS Reports
- October 2023, Charting Your Course
- September 2023, Enrolled Student Survey Results
- August 2023, Student Personas
- July 2023, Military Affiliated Students
- June 2023, CCCC Summer Bucket List
- May 2023, The 2023 Graduate Profile
- April 2023, Why Submit a FAFSA
- March 2023, Celebrating Continuing Education
- February 2023, CCCC Data We Love
- January 2023, Three Seasons of IPEDS
- December 2022, 5 Top 5’s of 2022
- November 2022, Retention Milestones